Article Excerpt
Learn about facts, stats, and perceptions on home ownership in America in 2023. Is home ownership possible for you?
The number of homeowners rose dramatically from 2020 to 2022 across the country. The market is still going strong in 2023, even if American homebuyers have cooled off since the pandemic. The percentage of houses occupied by their owners has stayed fairly steady in recent years, which suggests that more people are renting homes as well as buying them.
The dream of homeownership looks very different for different people. Younger people may not understand owning a home as a realistic prospect in the near future. Statistics about high sales prices for homes might encourage that view, but many programs are available to help people who want to own a home. Additionally, sales prices are declining as interest rates have increased since the refi boom of 2022.
Homeownership Rate
After every calendar quarter, the U.S. Census Bureau publishes data regarding homeownership rates. Before we dive into the numbers, though, we should be clear about what that term means.
What is the “Homeownership Rate”?
The term “homeownership rate” might be a bit misleading. It does not measure the percentage of people in the U.S. who own homes. Instead, it measures the percentage of homes that are occupied by their owners, as opposed to being occupied by renters. The percentage is calculated by dividing the number of owner-occupied “housing units” by the total number of occupied units. The number of vacant housing units is not part of the calculation.
2023’s Homeownership Rate
The most recent data available to the Census Bureau are from the first quarter of 2023. As of then, the nationwide homeownership rate is approximately 66%. Texas is slightly below the national rate, at 64.2%. For major metropolitan areas in Texas, the rates are as follows:
Austin-Round Rock: 63.4%
Dallas-Fort Worth-Arlington: 61.5%
Houston-The Woodlands-Sugar Land: 60.9%
San Antonio-New Braunfels: 68.3%
The Census Bureau estimates the total number of “housing units” in the country to be a bit over 144 million. Of those, about 129 million are occupied, and about 85 million are occupied by the owners.

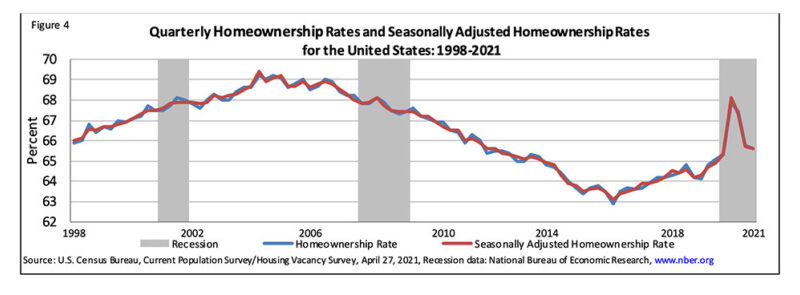
Image from Census.gov
The homeownership rate can fluctuate by season, and it has varied rather widely over time. In the past twenty years, it reached a high of 69.1% in 2005, and a low of 63.5% in 2016.
How many people rent and how many people own homes?
The homeownership rate can give us an idea of how many people own their homes versus how many people rent. Of the approximately 129 million occupied homes in the country, 85 million are occupied by the owners, and about 44 million are occupied by renters. Another 15 million or so remain vacant.
Homeownership Distribution by Age
Breaking the homeownership rate down by age offers a more nuanced view of the situation in the U.S. The homeownership rate for most Millennials, generally defined as people born between 1981 and 1996, is less than half of the rate for people age 65 and older. The website Statista offers a breakdown of data for the third quarter of 2022 by age groups:
Under 35 years of age: 39.3%
35-44 years: 62.5%
45-54 years: 71.4%
55-64 years: 74.6%
65 and up: 79.5%
Perceptions of Homeownership by Age
The oldest Millennials, using the standard cutoff points for their generation, are turning 42 this year. The youngest will be turning 27. Most Millennials are well into adulthood, or even into early middle age, depending on how one might choose to look at it. The oldest members of Generation Z, which includes people born from 1997 to 2012, are well into young adulthood. How these groups perceive being able to buy a home is important data.
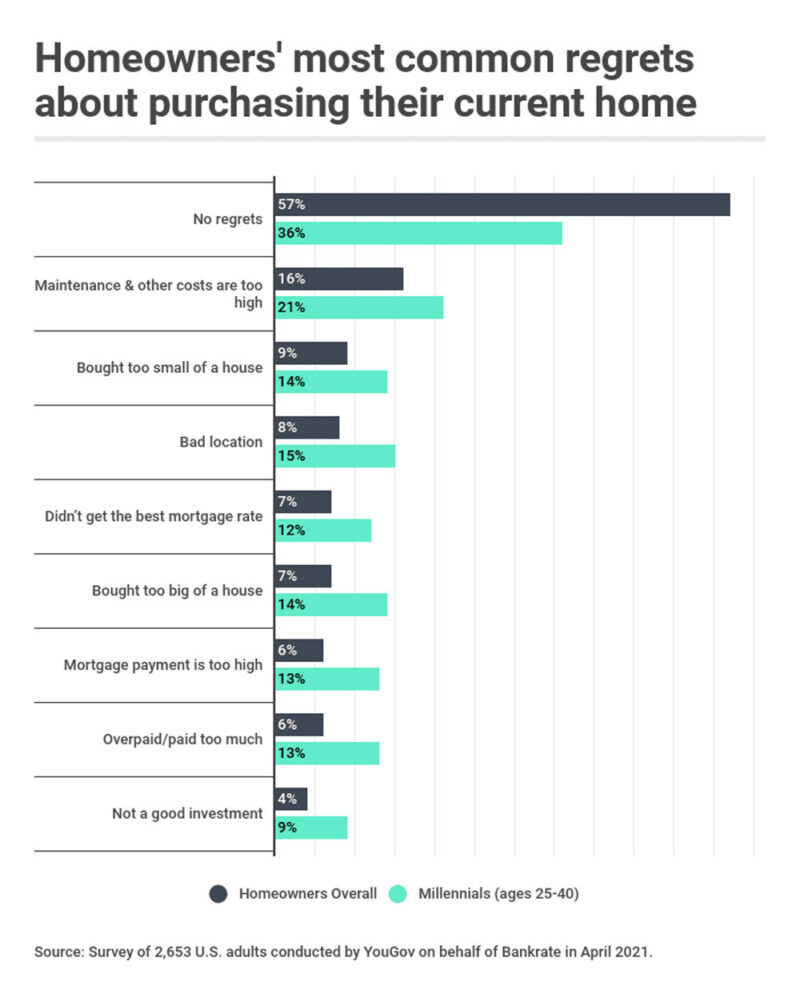
This type of statistic is much more subjective than basic facts about homeownership, so it is not something the Census Bureau provides. Surveys by private organizations seem to suggest that both Millennials and Gen Z tend to take a pessimistic view of homeownership. One survey from mid-2022, for example, found that a majority of people in those age groups want to own a home, either now or in the future, but worry that they won’t be able to afford it. The survey also found that 74% of adults in the U.S. rank homeownership at the top of a list of “hallmark[s] of achieving the so-called American Dream.” That number drops to 65% for Millennials and 59% for Gen Zers. That’s still a majority of people in both groups, but at rates that are notably lower than for older generations.

Image from CNBC
As for younger generations’ future prospects for homeownership, it all depends on who you ask. Some believe tough times are still ahead. Others think Millennials’ time for homeownership has come. In a significant development, more Millennials own homes than rent them as of early 2023.
Gen Z currently comprises about 4% of home buyers, according to a report from the National Association of Realtors (NAR). This is an increase from only 2% in 2021. Many Gen Zers seem to be skipping the rental phase of young adulthood. The NAR found that 30% of Gen Z homebuyers are moving from the homes of family members directly into their own homes.
Most Commonly-used Mortgage Programs
The Consumer Financial Protection Bureau (CFPB) collects information about mortgage loans from lenders. Its most recent report covers 2021. Lenders originated over 4.3 million purchase-money mortgages for owner-occupied homes that year. Of those, more than 3 million were conventional loans. The distribution of non-conventional mortgage programs was:
FHA loans: 58.8%
VA loans: 32.9%
USDA loans: 8.1%
Mortgage Credit Availability
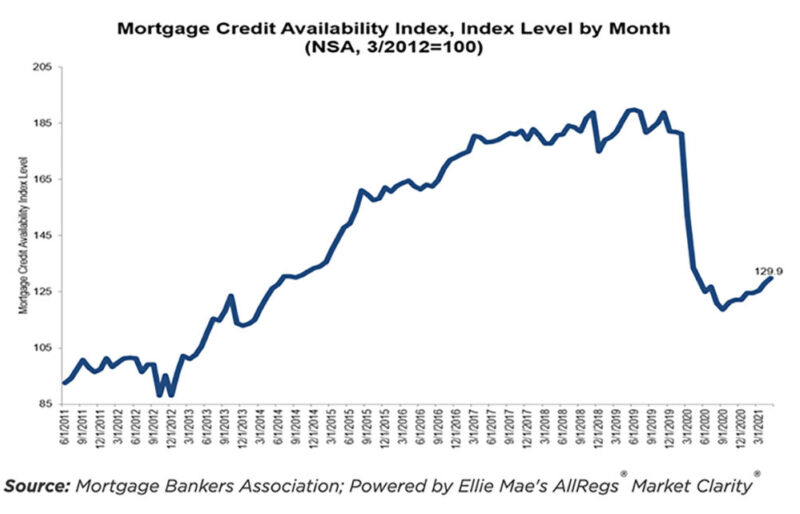
The Mortgage Bankers Association (MBA) issues a periodic report called the Mortgage Credit Availability Index (MCAI), which measures mortgage lenders' standards for extending credit. The higher the MCAI, the looser the restrictions for mortgage loans.

Image from MBA.org
As of the beginning of April 2023, the MCAI was at 99.6, a drop of 0.9% from the end of 2022. According to the MBA, this indicates a “tightening” in lending standards. The MCAI has two parts: the Conventional MCAI and the Government MCAI. The overall decline appears to be due to the Government MCAI. The Conventional MCAI, which includes most residential mortgage loans, increased by 0.5%.
Is homeownership possible for you?
The Wood Group of Fairway helps people throughout Texas realize the dream of homeownership. If you’d like to learn more about your local market - or if you can qualify for a mortgage - get started with a few quick questions!


